
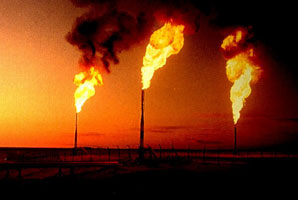
Natural gas flaring (NOAA). Often it is less expensive to burn natural gas than it is to get it to market.
Since I am in the field installing science onto an airplane, this is going to be a short post. In a prior post, I showed graphs with natural gas prices being de-coupled from oil (recreated and updated with the latest numbers here). I decided it was high time to do some maths related to it. All the data is from the EIA, and all the analysis is my own. I had to interpolate average coal prices for the past two years based on its link to specific coal prices.
If you know what correlation is (I think most of you do), skip over the description of correlation and go straight to Maths, since it is very rudimentary, and you could probably make fun of me for writing it. If you want to do better statistics with the data set, let me know and we can have some fun.
One important point! These prices are well-head prices. In other words, it is roughly what the major distributors of gas will pay for the stuff. Your prices as and end-consumer won't change. In other words, they pay less when the price goes down, but they sell you to at the same price. That works out pretty well for them, doesn't it?
Description of Correlation and its Limitations
Correlation: correlation is a measure of how closely two data sets match. In other words, correlation answers the question: when one set of data goes up, does the other go up? It is important to remember that correlation does not imply causation. In the case of natural resources, this idea is very easy to understand. The price of oil and natural gas both rose together in the 90s. This does not mean that the price of oil rose on its own, causing the price of natural gas to rise. Natural gas prices rose for pretty much the same reasons as oil prices rose. In this case, demand for things that burn and produce heat caused an increase in price in both of them.

Wellhead hydrocarbon prices over the past 3 decades. The price of natural gas used to follow the price of oil. In 2008 this changed thanks to hydrofracking.
A classic example of the abuse of correlation and causation is ice cream and murders. Both murder rates and ice cream purchases tend to rise in cities at the same time. One could conclude that ice cream causes murderous rampages, or that the best way to relax after murder is to eat ice cream. Both of these are silly to conclude. More likely, there is an outside factor that causes both. It could be hotter weather makes people eat more ice cream, and simultaneously makes them more irritable. Or it could be that hotter weather makes people eat more ice cream, and it also makes more people be outside, where they are more likely to get murdered than in their homes. The point is that correlation can show that two factors are tied together, but often requires more than that to show a direct causal link.
Hokay. Correlation goes from -1 to 1. 0 means no correlation, 1 means perfect positive correlation: one thing rises, the other one rises by a predictable amount. -1 means perfect negative correlation: one thing rises and the other falls by a predictable amount.
The Maths!
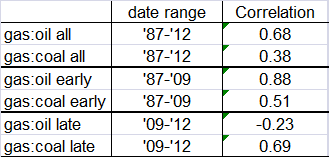
The overall correlation between oil and natural gas prices from 1986 to 2012 is .68. This is pretty good for noisy data sets (noisy meaning there are outside factors, like commodity speculation in the markets). The correlation between natural gas and coal over that period is .4. This is pretty low, and partially represents inflationary increases in prices of both of these over time (if I had used real 2005 dollars instead of nominal dollars, all of these correlations might decrease).
More important is breaking out the correlations between early and late. I mentioned in the prior price post that decoupling began to happen in 2007, and then accelerated. The 22 year correlation between gas and oil until end of 2008 was .88, very high, much higher than .68. After this, the gas:oil correlation becomes -.23. The prices have become decoupled. At the same time, the correlation between gas and coal rises to .69. Not great, but definitely more coupled than gas and oil currently are.
One thing is clear about natural gas prices and correlation. Natural gas prices in the US used to be tightly coupled to oil prices. Natural gas prices in the US are no longer coupled to oil prices. They are instead coupled to coal prices, though not as tightly as the prices used to be coupled to oil prices.
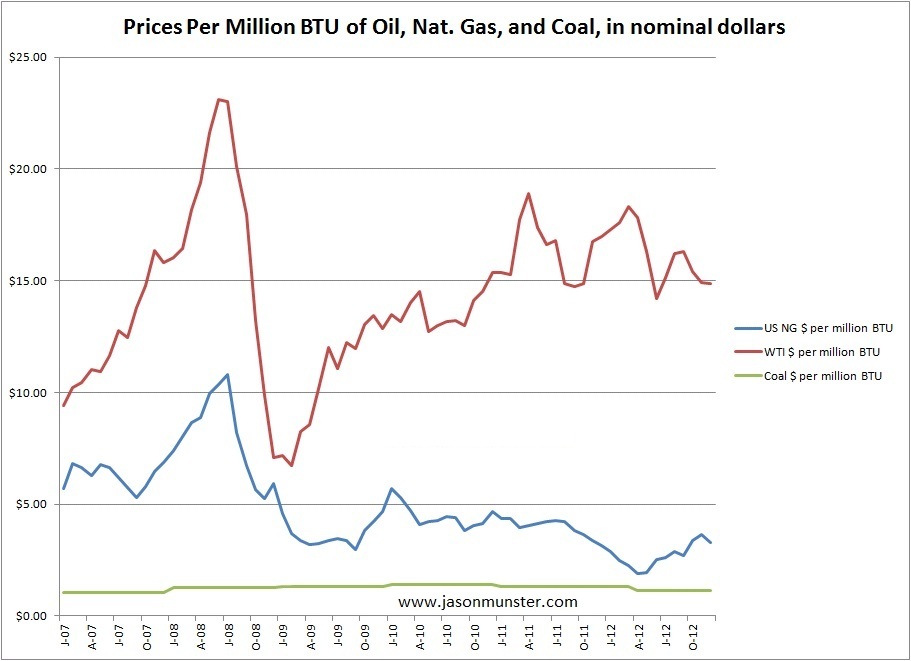
Hydrocarbon prices per million BTU after hydrofracking. Pretty easy to see that decoupling, eh?
Now we discuss the cause. The cause in this case is definitely hydrofracking in the US. Outside the US, oil and gas prices are still more correlated. Okay, that was a short discussion.
Some caveats: the numbers I used for historic coal prices are mean annual coal spot prices weighted for what was bought. These are correlated to monthly oil and gas prices. These coal prices were not available for the last two years. They are, however, tightly coupled to coal prices in general. I looked at similar priced coal over the two years, and extrapolated the prices for my model based on these. Given the very tight link of mean coal prices to the price of specific types of coal, this is not a faulty method. If someone were to use a more consistent methodology to determine coal prices throughout the entire time period I have sampled, it would produce results that are nearly identical.
Conclusions
Oil prices and natural gas prices were historically tied. With the advent of fracking in the US, natural gas prices decoupled from oil prices, and have coupled with coal prices.
So much for a short post, eh?
Pingback: Nuclear Reactors Final | Jason Munster's Energy and Environment Blog