Nuclear Power Plants!

Pretty nuclear power

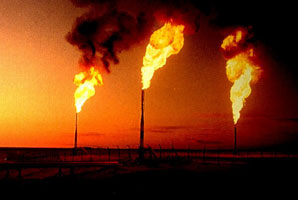
A nuclear power plant and its cooling towers. Source: nuclear regulatory commission

Excellent news! I figured out inline LaTeX in wordpress, so my equations look even more baller.

If you had to guess how many pounds of coal you needed to equal the power output of a single pound of uranium for a nuclear reactor, what would you guess? 100 pounds? 1000? Try 3,000,000 pounds of coal to equal the energy in one pound of uranium. The energy contained in a nuclear reaction is immense. In a timely fashion, XKCD recently made a post about this:

Seriously. Read it all. And make sure you know what alt text is before you read it

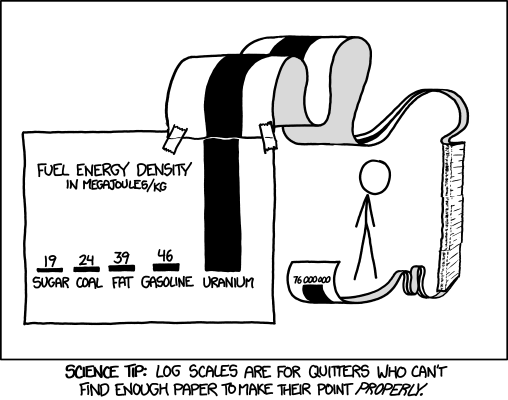
XKCD comic about log scales. More importantly, it shows uranium is gigantically more energetic than coal. Also, note that my coal calculation have more power than his. It's cause I assumed a better burning, cleaner coal in order to be nice to coal. It's old and it's days are numbered, so we should be nice to it, no? Check out xkcd.com

This will be a three part series about nuclear power. This post gives a very brief description of how a nuclear reactor works. The next two will be what happened in Chernobyl and Fukushima, and another on how the newest generation  of nuclear reactors are much more safe than the older ones.

A nuclear power plant is basically your standard steam or thermal power plant. Except that it is surrounded by a ton of protection to prevent or contain explosions and nuclear fallout. Unfortunately, Cold War Russia forgot all this protection, which is why Chernobyl turned into a huge mess. Fortunately, Fukushima did have these protective measures, and no one got lethally dosed. More on this in a future post.

First, some math!

In the coal post, we showed that (extremely high quality) coal contains 34MJ per kg. Let’s figure out how much energy is in a kg of uranium!

Radiation warning symbol. Uranium is radioactive.

Radiation warning symbol. Uranium is radioactive.

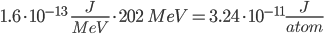
We learned as kids that mass and energy are conserved. They are related by Einstein’s equation E=MC^2. When a nuclear reaction happens, the mass of resulting elements are lower than the mass of the starting elements. This energy has to be released as heat. For a nuclear reaction of U-235, ~202 MeV are released (eV is electron-volts, a unit of energy) per atom.

Seriously, how good does this math look right now?

This doesn’t sound like much, considering coal has . Lets continue with maths.

Remember Avogadro’s number? ? It’s the number of molecules to make X grams of a molecule, where X is the atomic mass. It turns out the atomic mass of U-235 is 235. Funny how that works, right?

Hokay.

This is 2.4 million times the energy density of very good coal. It is closer to 3.5 million times the energy density of coal that is typically used to generate electricity.

Nuclear power!

A nuclear power plant is a thermal power plant. It harnesses the heat of a nuclear reaction to create steam.

Uranium-235 decays naturally, releasing the massive amount of energy described above. One of the decay products, a neutron, can hit another U-235, causing that to decay. Each decay produces several neutrons. The process becomes a chain reaction that can grow exponentially.

A chain reaction image courtesy of the Nuclear Regulatory Commission

A chain reaction image courtesy of the Nuclear Regulatory Commission

U-235 is formed into pellets, and then into rods, which are put in the reactor core. The decays produce heat, which is absorbed by water, which then drives the steam cycle. To prevent a runaway reaction, control rods are inserted between the U-235 rods. These control rods absorb neutrons from the nuclear decay. Once absorbed, these neutrons cannot break another U-235. The reaction becomes controlled.

That is pretty much it. There are a ton of safety measures beyond this, however.

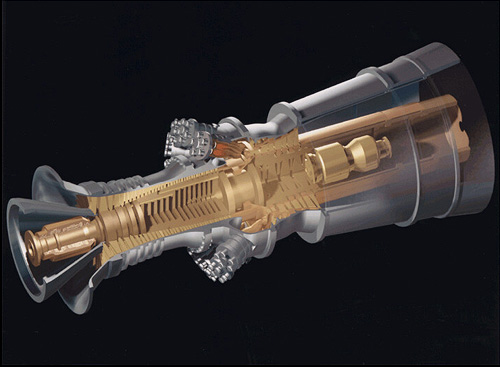
These reactions are contained within a reactor pressure vessel. The vessel is designed to contain the reaction. To reduce maintenance, these pressure vessels need to be a single piece. Currently only Japan, Russia, and China have the capability of building the massive pressure vessels needed for nuclear power plants. South Korea will have this capability within the next year.

Another NRC picture. Schematic block diagram of a nuclear reactor. A pressure vessel that is a single piece requires less maintenance.

The pressure vessel is the second line of defense against a reactor meltdown, after the control rods. Outside of this is a huge concrete containment structure that allows the pressure vessel to survive an earthquake, bomb, or airliner crash. It also prevents the escape of nuclear gases in the event of an accident. Chernobyl did not have one of these. All current nuclear powerplants do, making Chernobyl a non-repeating event.

A nuclear plant will produce about 20 metric tons of nuclear waste per year. The waste cools in a pool for spent fuel rods for a couple of years before being mixed with glass and stored in massive concrete cooling structures.

Can Nuclear Power Alone Replace Fossil Fuels? Unfortunately, probably not in the short term.

If the US wanted to replace all of its fossil fuel electricity with nuclear power in the next 20 years, it would have to build a lot of nuclear power plants. The US currently uses more than 250GW of installed capacity of fossil fuels for electricity. If this grows at 3% per year, we will need more than 450GW of power from this source. We would need to build 450 1GW nuclear reactors in 20 years, or nearly one every two weeks. Considering we haven't built a nuclear reactor from start to finish in over four decades, this is not an immediately solution. We have to get on building nuclear right off if we want this to be any sort of solution.

Natural Gas Prices 2

Natural gas flaring (NOAA). Often it is less expensive to burn natural gas than it is to get it to market.

Since I am in the field installing science onto an airplane, this is going to be a short post. In a prior post, I showed graphs with natural gas prices being de-coupled from oil (recreated and updated with the latest numbers here). I decided it was high time to do some maths related to it. All the data is from the EIA, and all the analysis is my own. I had to interpolate average coal prices for the past two years based on its link to specific coal prices.

If you know what correlation is (I think most of you do), skip over the description of correlation and go straight to Maths, since it is very rudimentary, and you could probably make fun of me for writing it. If you want to do better statistics with the data set, let me know and we can have some fun.

One important point! These prices are well-head prices. In other words, it is roughly what the major distributors of gas will pay for the stuff. Your prices as and end-consumer won't change. In other words, they pay less when the price goes down, but they sell you to at the same price. That works out pretty well for them, doesn't it?

Description of Correlation and its Limitations

Correlation: correlation is a measure of how closely two data sets match. In other words, correlation answers the question: when one set of data goes up, does the other go up? It is important to remember that correlation does not imply causation. In the case of natural resources, this idea is very easy to understand. The price of oil and natural gas both rose together in the 90s. This does not mean that the price of oil rose on its own, causing the price of natural gas to rise. Natural gas prices rose for pretty much the same reasons as oil prices rose. In this case, demand for things that burn and produce heat caused an increase in price in both of them.

Long-term prices 1-13

Wellhead hydrocarbon prices over the past 3 decades. The price of natural gas used to follow the price of oil. In 2008 this changed thanks to hydrofracking.

A classic example of the abuse of correlation and causation is ice cream and murders. Both murder rates and ice cream purchases tend to rise in cities at the same time. One could conclude that ice cream causes murderous rampages, or that the best way to relax after murder is to eat ice cream. Both of these are silly to conclude. More likely, there is an outside factor that causes both. It could be hotter weather makes people eat more ice cream, and simultaneously makes them more irritable. Or it could be that hotter weather makes people eat more ice cream, and it also makes more people be outside, where they are more likely to get murdered than in their homes. The point is that correlation can show that two factors are tied together, but often requires more than that to show a direct causal link.

Hokay. Correlation goes from -1 to 1. 0 means no correlation, 1 means perfect positive correlation: one thing rises, the other one rises by a predictable amount. -1 means perfect negative correlation: one thing rises and the other falls by a predictable amount.

The Maths!

NG correlations

The overall correlation between oil and natural gas prices from 1986 to 2012 is .68. This is pretty good for noisy data sets (noisy meaning there are outside factors, like commodity speculation in the markets). The correlation between natural gas and coal over that period is .4. This is pretty low, and partially represents inflationary increases in prices of both of these over time (if I had used real 2005 dollars instead of nominal dollars, all of these correlations might decrease).

More important is breaking out the correlations between early and late. I mentioned in the prior price post that decoupling began to happen in 2007, and then accelerated. The 22 year correlation between gas and oil until end of 2008 was .88, very high, much higher than .68. After this, the gas:oil correlation becomes -.23. The prices have become decoupled. At the same time, the correlation between gas and coal rises to .69. Not great, but definitely more coupled than gas and oil currently are.

One thing is clear about natural gas prices and correlation. Natural gas prices in the US used to be tightly coupled to oil prices. Natural gas prices in the US are no longer coupled to oil prices. They are instead coupled to coal prices, though not as tightly as the prices used to be coupled to oil prices.

Hydrocarbon prices per million BTU after hydrofracking. Pretty easy to see that decoupling, eh?

Hydrocarbon prices per million BTU after hydrofracking. Pretty easy to see that decoupling, eh?

Now we discuss the cause. The cause in this case is definitely hydrofracking in the US. Outside the US, oil and gas prices are still more correlated. Okay, that was a short discussion.

Some caveats: the numbers I used for historic coal prices are mean annual coal spot prices weighted for what was bought. These are correlated to monthly oil and gas prices. These coal prices were not available for the last two years. They are, however, tightly coupled to coal prices in general. I looked at similar priced coal over the two years, and extrapolated the prices for my model based on these. Given the very tight link of mean coal prices to the price of specific types of coal, this is not a faulty method. If someone were to use a more consistent methodology to determine coal prices throughout the entire time period I have sampled, it would produce results that are nearly identical.

Conclusions

Oil prices and natural gas prices were historically tied. With the advent of fracking in the US, natural gas prices decoupled from oil prices, and have coupled with coal prices.

So much for a short post, eh?

Hydraulic Fracturing!

Fractured Shale and pipe

Schematic of what hydrofracking does to the surrounding rock. Source

This is one of my favorite topics! Hydrofracking (short for hydraulic fracturing) is used to extract both natural gas (Barnett and Marcellus Shales) and oil (Bakken Shale, a few other places) from regions that used to be too dense to extract hydrocarbons from, or that would otherwise not produce much.

These dense rocks, called “tight formations” (formations meaning rock beds, tight meaning not having connected holes) are not permeable enough for hydrocarbons to move out of them at high flow rates. (Permeability means fluids can flow through something. Paper towel is permeable, plastic is not.) Believe it or not, many types of rocks are very permeable. They have lots of interconnected cracks. Shale is not such a rock. It may have space inside it with oil or gas, but these spaces are not connected by the cracks that would allow these hydrocarbons to flow out to a well. A well drilled vertically into this shale would produce almost nothing. These hydrocarbons stayed in the ground. Hydrofracking changed that.

Hydrofracking

Hydrofracking, in short, is exploding cracks and holes in the ground with shaped charges and water and then pounding sand into those holes. Hydrofracking requires 2 to 3 million gallons of water and 2 to 3 million pounds of sand per well.

Hydraulic Fracturing first requires drilling a hole in the ground. These holes can be kilometers deep. The advent of horizontal drilling allows for drilling horizontally by bending the steel tubes of the well. Sounds crazy that steel can bend? Given 300 feet of pipe, the steel pipes can bend  at a right angle. Horizontal drilling can cost up to 4x what normal drilling costs, so it is only used in places where it can greatly increase production. Like hydrofracking applications, where it makes a well go from zero production to up to 2000 barrels of oil per day.

This is where the magic happens. Formations that hold oil and natural gas are often horizontal. First a vertical well is drilled, then it goes horizontal for up to 10km. For hydraulic fracturing, shaped charges are planted inside the pipe in the horizontal section. They are then directionally exploded into the rock, creating large cracks in the rock extending away from the pipeline.

Next they pressurize a viscous fluid and cram it into the drilled hole using dozens of pumps to create massive pressure. This process can take dozens of trucks work of fluid, pipelines, and pumps. The trucks gang-pump fluid into the hole. The fluid finds the cracks in the pipe and rock made by the shaped charges. The fluid rips through the rock, rending the cracks, expanding them in length and volume and connecting them. These cracks become very widespread. The former tight shale or sandstone formation that prevented the flow of fluids is now a series of connected cracks leading to the pipeline. Fluids can flow.

Hydrofracking pump trucks

Dozens of hydrofracking trucks pump hydrofracking fluid into the hole. Source.

When the hydrofracking fluid is drained, the cracks can close up again. To prevent this, something called a proppant is used. A proppant props open the cracks, much like leaving a door stopper in your door. Typically sand was used for this, but new proppants with special shapes and properties are being used as well, like ceramic beads covered in resin for deeper wells. The proppant is put in at the same time as the hydrofracking fluid. When the trucks reverse the flow of hydrofracking fluid and pump it back out, the proppant remains behind.

Fracking Proppant

Proppants hold the cracks open after the hydrofracking fluid is drained. Source

Proppants hold open the rock and allow flow, but this is not permanent. Flow reduces over time. The first year after hydrofracking happens is the most productive. Drilling and hydrofracking a hole, then closing it, reduces the hydrocarbons you will get out of the hole compared to drilling and pumping. If you frack a hole and then close it, the hole will ultimately produce a lot less hydrocarbons than if you drill and pump. In other words, once you have fracked, you gotta make use of that hole or you will lose a lot of money.

Natural Gas hydrofracking

Natural gas hydrofracking in the US is one of the more polarizing topics. The chemicals in fracking fluid are of such low concentration that it does not matter if it gets in the local water supplies. But they mix concentrated versions of these incredibly toxic chemicals into the fracking fluid. In other words, the fracking fluid may not be toxic, but the pure chemicals they keep on-site to mix into these trucks sure are. If any of this leaks into the environment (it has), it can be quite damaging. One can hope that this sort of thing is both rare, and well-controlled in the future.

There is the leaking associated with hydrofracking for natural gas. Howarth (2012) estimated there is an upper limit of 8% of methane leaking from natural gas extraction and transport for hydrofracking. Given the factor of 23 greenhouse warming potential of methane, this is a problem. Compounding the problem is that mineral and resource policy are states rights in the US.  NY and PA do not have the law history in place or the resources to figure out how to deal with the potential pollution from fracking, nor the resources to enforce the policy. This, in part, is why fracking has been stalled in the Marcellus in many places.

Oil hydrofracking

The Bakken formation. Here the sandstone contains the oil. It is sandwiched between two impermeable layers of shale.

The Bakken formation. Here the sandstone contains the oil. It is sandwiched between two impermeable layers of shale.

There are other important implications for fracking specific to oil production. In order to drill, a company has to lease drilling rights. When a company leases drilling rights, they have obligations to produce certain amounts of hydrocarbons within a short time-frame, or they lose the lease. So they drill. A lot. Remember how we talked about holes losing productivity over time? Once a fracked hole is open, they are unlikely to close it. The problem? In the Bakken shale, they co-produce natural gas with oil. There is no infrastructure to pipe the natural gas away. They burn it instead. Some of it may leak. In other words, they are producing massive amounts of pollutants and GHGs. North Dakota does not have the ability to quickly build infrastructure to capture and transport this natural gas. And North Dakota doesn’t quite have a population that is accustomed to or capable of having a lot of bureaucracy to deal with these issues and enforcing policy. It’ll be a while before this is handled. In the meantime, North Dakota will light up the night sky like a mega-metropolis.

Bakken at night edit

The flaring of natural gas 24/7 in Bakken makes North Dakota look like it has one of the largest cities in the US. If you look at the picture below, you can see a stark contrast.


That light in North Dakota didn't used to be there. Courtesy Nasa

Implications

You may have heard that Hydrofracturing for natural gas is a phenomenon that is not repeatable outside the US. This is untrue. It likely cannot be repeated in Europe, but China is just discovering shale gas deposits that could rival or outsize that of the US. There are also likely large deposits in Africa. As far as shale oil goes (not to be confused with oil shale!), it is also likely available outside the US. We are just really good at getting stuff out of the ground here.

You may have also heard that this could make the US energy independent by 2035. If we don't grow our appetite for oil, this could possibly happen. It is unlikely, but that is a topic for later. The US is already one of the largest producers of oil on the planet. Is this a good thing? It is a mixed bag. It will definitely be a boon to the economy if we are not sending nearly $1 billion a day overseas to satiate our demand for oil (we use 18 million barrels a day in the US, importing 10 million of those @ $100/barrel, or a billion dollars a day). It would not prevent the middle east from getting a ton of money from oil still, as Asia and Europe will still buy all the middle east oil. It likely won't decrease the price of gas in the US, since any increase we make in production will be matched or outstripped by increased demand in China (1.3 billion people), then India (1.2 billion people), then Africa (2 billion people) in the 2nd half of the century. In other words, it won't change much on a world scale. Producing this much oil domestically also will keep the US addicted to oil, rather than transitioning to cleaner energy sources and more rational lifestyles that don't burn tons of resources. But the whole quarter of a trillion dollars per year that we aren't sending overseas, if handled properly, could easily boost our economy and help subsidize our way out of oil addiction. It's clearly a thorny topic, and beyond the scope of this post.

Conclusions

Fracking will change the energy landscape in the US by providing a lot more natural gas and oil domestically. It has downsides, from increased flaring of natural gas to domestic pollution, but it does have upsides that can be harnessed for the good of our future.

Natural Gas Power Plants

Excellent news! No math today. Bad news! There are some confusing terms here. Every thermal power plant drives a turbine to produce power. There is a special type of turbine called a gas turbine that directly burns natural gas inside of it to produce power. There are a few places where I use gas turbine and turbine in the same sentence. Sorry about that.

Natural gas fired power plants come in two primary flavors: standard thermal plants, and fancy jet turbines. The former has the same internals as a coal power plant and can provide baseload power, the latter is for peak power. Both produce less pollution than coal, simply because natural gas is cleaner than coal and produces more energy per unit CO2 emitted. Natural gas plants contribute to GHG emissions and PM2.5 (PM 2.5 can form from emissions of NOx, which occurs from any combustion). With hydrofracking causing a glut in natural gas in the US, producing power via gas is cost-competitive with coal in the US, and recently has been replacing coal to produce electricity. This has caused the US to decrease its annual CO2 emissions by nearly 10%.

Conceptual drawing of a natural gas turbine

Let’s get down into the meat of how these plants work. We have discussed how standard thermal plants work in a prior post. The jet turbine power plant is pretty simple. It is very similar to the turbines found on airplanes. The fuel is injected and burnt. It expands and drives a turbine to generate electricity. These systems get incredibly hot. They have thermal efficiencies approaching 30%. Unlike thermal plants, these gas turbines can fully ramp up power in about 20 minutes. These turbines also need to shut down frequently for repairs. Continuous operation for days at a time is not possible, or they will become very damaged. For these reasons, these turbines are typically used only for peak power production. One final difference is that a gas turbine has more like a 20 year life time, whereas a thermal power plant has a 50 year lifetime.

A natural gas turbine via DOE

Gas turbines can be combined with standard thermal plants often use what is called a combined cycle format. Before getting into that, let’s briefly revisit how a normal thermal plant has higher efficiencies. In a normal thermal power plant, the steam coming out of the first turbine has lost some heat and pressure. It is then more or less directed to a subsequent turbines that are designed to be efficient at lower temperatures, and even with wet steam. This series of turbines extracts much more heat, and thus much more efficiency, than a single-cycle turbine.

This combined cycle power plant has two sections: the thermal section and the gas turbine section. Typically the thermal section stays on. When peak electricity production is needed, the gas can go into the gas turbine instead of the thermal section. Our gas turbines discussed above produce temperatures in excess of 900 C. This waste heat can then be shunted to boil water in a more traditional thermal plant. Combining these processes together can result in a 60% thermally efficient plant. This is very efficient. If you recall from our previous article, thermal plants take a long time to ramp up power production. These combined cycle plants require the thermal section to almost always be on. The thermal section of the plant will provide baseload power, and the gas turbine part will spin up to provide peak power. These combined cycle plants are incredible versatile. They make money every day by operating in baseload configuration, and then make extra money as soon as demand requires more power.

This brings up a quick question. The thermal section of the plant is not as efficient as using both the gas turbine and the thermal section together. In other words, burning the natural gas in the gas turbine first extracts more energy from it. Why do these gas turbines not always run, then? Well, as we mentioned, the gas turbines are more fragile. They can’t always run, and they need frequent repairs. The economics of it works out so that even though they extract more energy from the gas, it is only worthwhile when electricity prices are high.

Conceptual image of a combined cycle natural gas power plant

Conceptual image of a combined cycle natural gas power plant

What are the downsides of these NG plants? They produce less pollution than coal plants by a good margin. They require less mitigation of pollutants, so they are much easier to build than coal plants, and are built more rapidly at a lower expense. They produce less GHG than coal plants, both because the combined cycle system is more efficient and because NG is a more CO2 efficient fuel than coal. They produce more pollutants than nuclear power plants or wind turbines or solar power, however. And outside of the US, the fuel is much more expensive than coal.

Let’s discuss that last point for a second. The low NG price in the US makes this very affordable. Other countries that care more about clean air than the US are not as concerned about the higher price of natural gas vs. coal electricity. They care more mitigating adverse health effects caused by coal power plant emissions. Japan is a great example. The largest importer of natural gas in the world, Japan is set to import a lot more of it. After the Fukushima Daiichi nuclear plant meltdown (future post on this and Chernobyl!), Japan is set to phase out nuclear power. They don’t want to build coal power plants, because they are dirty. They intend to import gas (they are even considering building an undersea pipeline from Russia to accomplish this!) and produce NG electricity to replace their retiring nuclear plants.

The technical section

The major emissions of these power plants are CO2, methane, and NOx. On a 100 year timescale, each molecule of methane and NOx is 21 and 310 (respectively) times more powerful than CO2. This scaling of potency is called the Greenhouse Warming Potential (GWP) of a compound. Methane is leaked from incomplete combustion and also from line leaks and delivery leaks, NOx is a byproduct of burning things in a nitrogen based atmosphere. Another way to put it: since our atmosphere is 78% nitrogen, burning anything, even a campfire, will produce NOx. In the graph below, excerpted from an NREL document , we see that while CO2 is the primary emission, multiplying these emissions by the GWP shows that methane is a significant % of total warming potential.

Nat Gas Emissions GWP

Relative to the other natural gas emissions, NOx is not important to greenhouse warming. Why would they want to control it? Because it is a precursor to PM2.5. The stuff that causes minor health issues, like heart attacks and death. NOx is mitigated by spraying ammonia (NH3) into the flu gas (flu gas is a fancy way of saying the stuff that comes out of the smokestack). The NH3 mixes with NOx to produce H2O and nitrogen. Some NOx is still is emitted after this scrubbing, and still leads to PM2.5, causing local pollution. But in much less quantity than a coal fired plant.

In review, natural gas power plants produce less pollution than coal fired power plants. There are some pretty neat technologies in these natural gas power systems. In the US, the electricity is nearly cost-competitive with coal. Other countries choose to produce power via natural gas because it is cleaner than coal, despite that it is 5x as expensive in those countries.

That’s all! Thanks for reading!