I finished my PhD last week. Today I start posting again. This is a month-long series, one post each week, regarding air pollution and our health. First, we discuss types of pollution, then the health effects of different types based on where you live (US vs. China as case studies), then we move on to the health effects of each type, finally we end on how you filter it.
Hint: Two posts ago (and over a year ago) I said I was taking a break to build a better pollution filter. I did that, and the final post in the series will be telling you all about that part. In the meantime, please go to www.getblueskies.com, sign up for our upcoming release emails (which will let you know when we launch on indiegogo with a discount for the first buyers), and share our website with your friends that might be interested.
Air Pollution
I was speaking with a physician about air pollution, and about which types cause asthma, and she was stunned that there is background research indicating that different types of outdoor pollution have differing relationships with asthma. Part of the reason for this was that she didn't realize how easy it was to differentiate which types of pollution come from which sources.
Okay, then. There are several major types of pollution. And NO2 from traffic is far and away the outdoor pollutant that that is most highly associated with our increasing asthma rates in the US (more on this in a future post).
Major Pollution Types
Particulate Matter is big chunky pollution. It is called PM10, or PM2.5, for how wide it is. PM10 is 10 microns wide, PM2.5 is 2.5 microns wide. For comparison, the average human hair is on the order of 100 microns wide (thin hair is about 17 microns, thick hair is up to 180). PM can be dust, fine soot, pet dander, or pest droppings (think cockroach poop). These can be very easily filtered with HEPA-style filters (HEPA filters are physical filters that block large pollution particles using small holes).
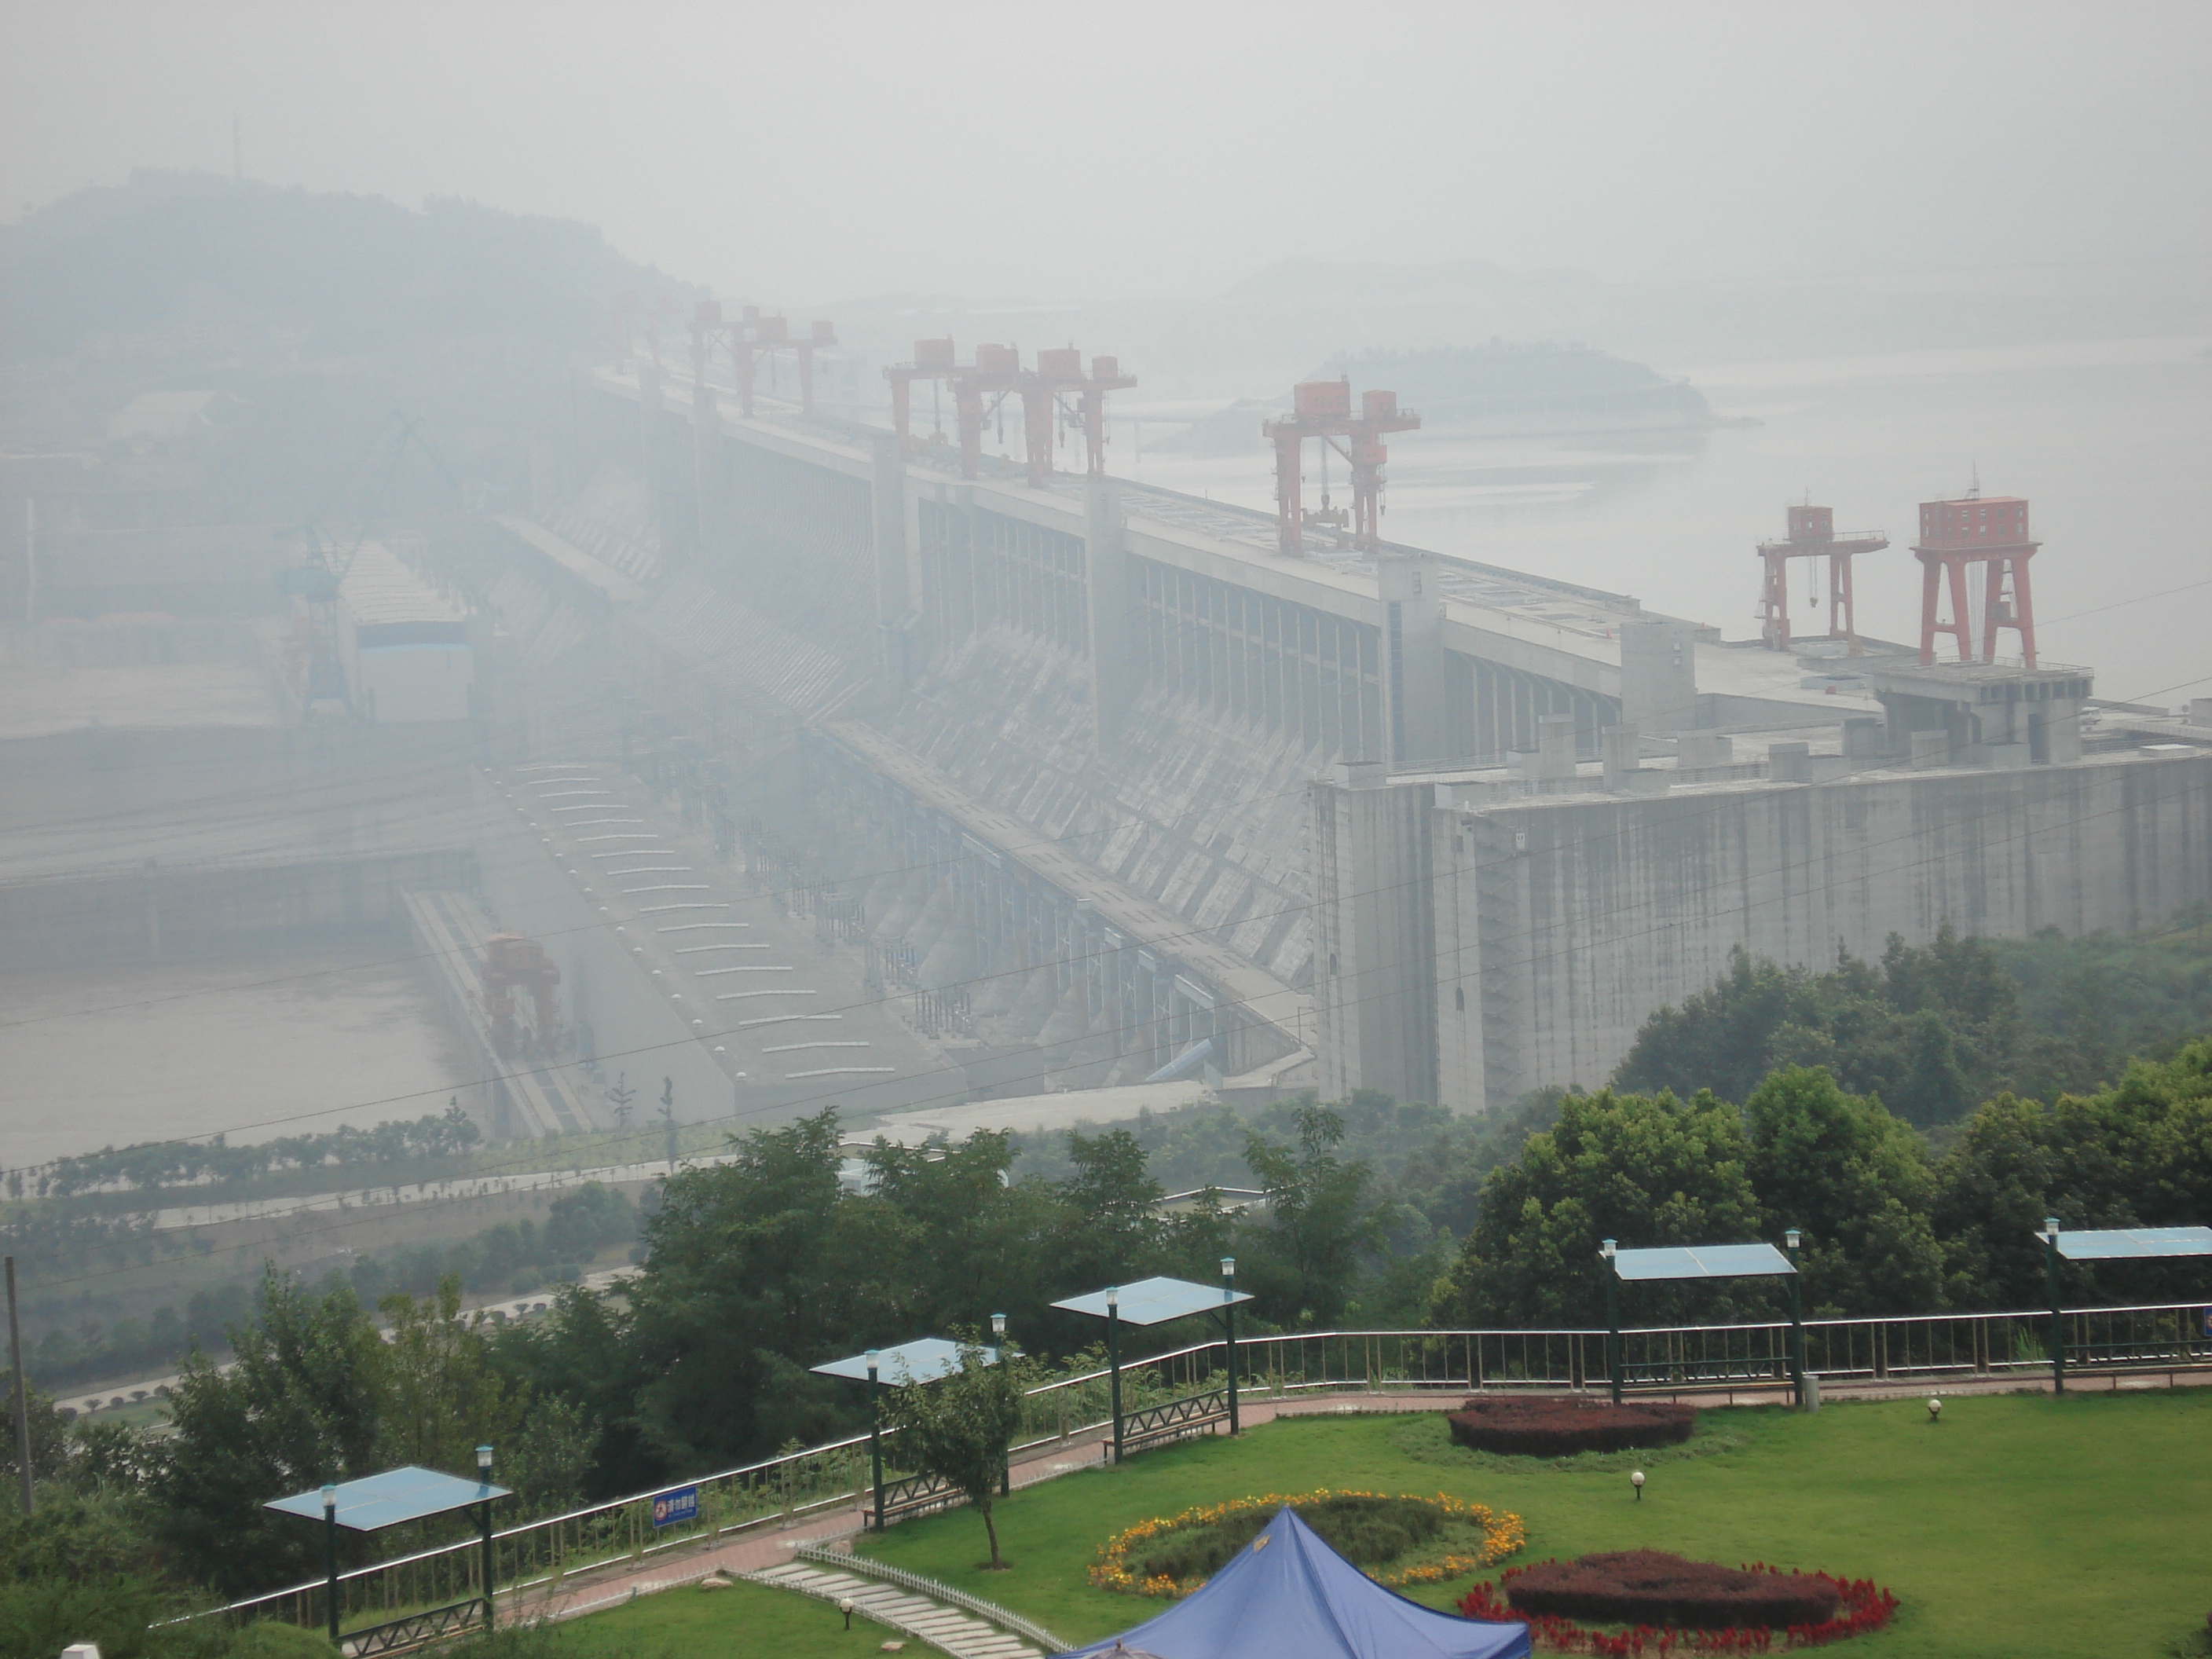
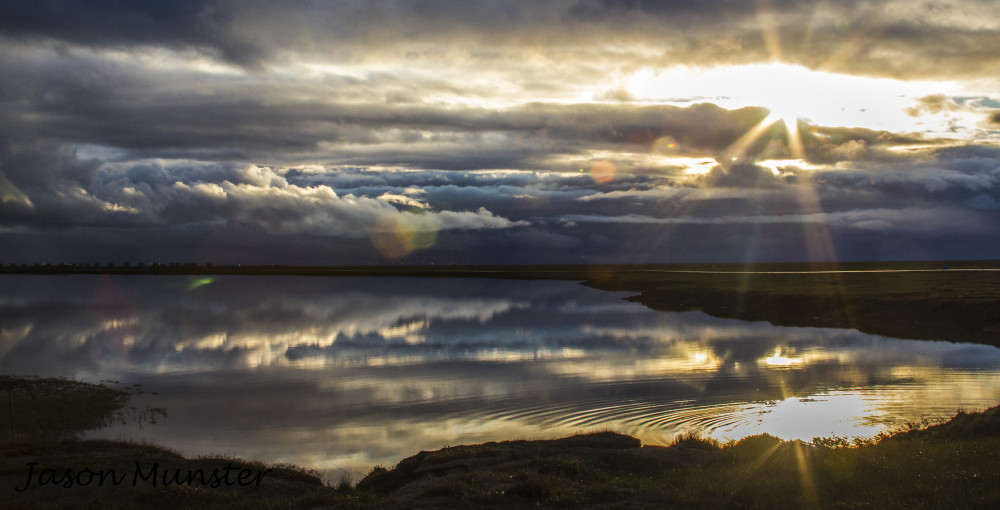
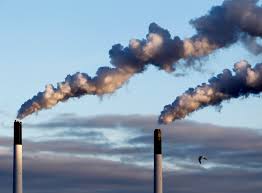
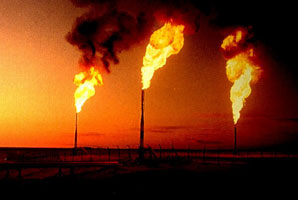
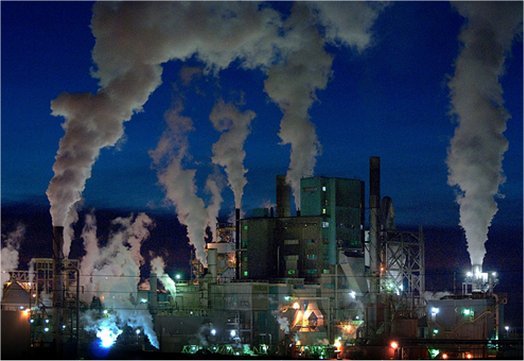
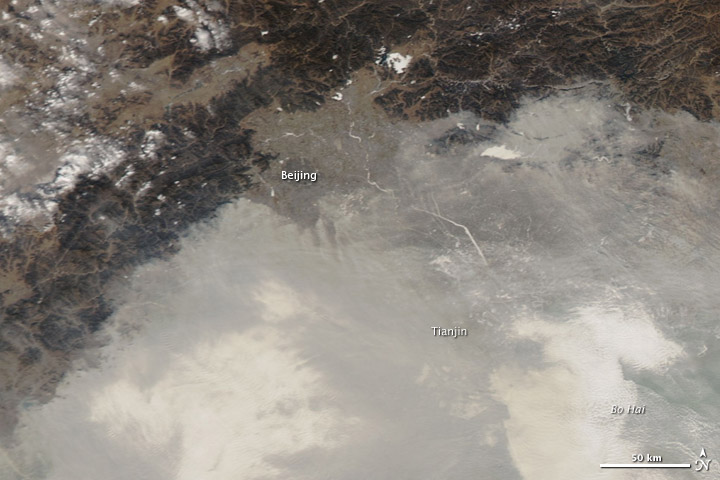
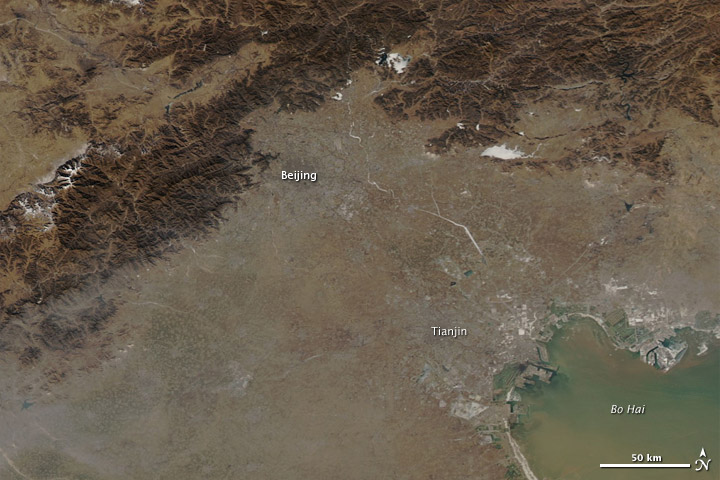
A photo from my time in China. PM pollution is pollution you can see.
Chemical Pollution is very defined and very small. It's specific molecules. It's about 10,000 times smaller than PM2.5. It's also about the size of the the air we breathe, so you can't physically filter it. It is things that you've heard of, like CO (carbon monoxide), SO2, and NO2 (these both become strong acids in water, which causes acid rain. Note that our lungs are about 100% humid air, so they become strong acids, like battery acid, in your airways). These are extremely difficult to filter, and tend to require chemical reactions (more on that on a later post!). We are focusing on SO2, which just comes with fossil fuels, and NO2, which comes about every time you burn something in our atmosphere (our atmosphere is 78% nitrogen, and 21% oxygen, when you burn things, it uses the oxygen to convert stuff into CO2 and other emissions, but at high heats, it also produces NO2. Higher heats means more NO2). We ignore CO for now, and we ignore CO2 because it doesn't cause immediate health threats compared to these other pollutants.
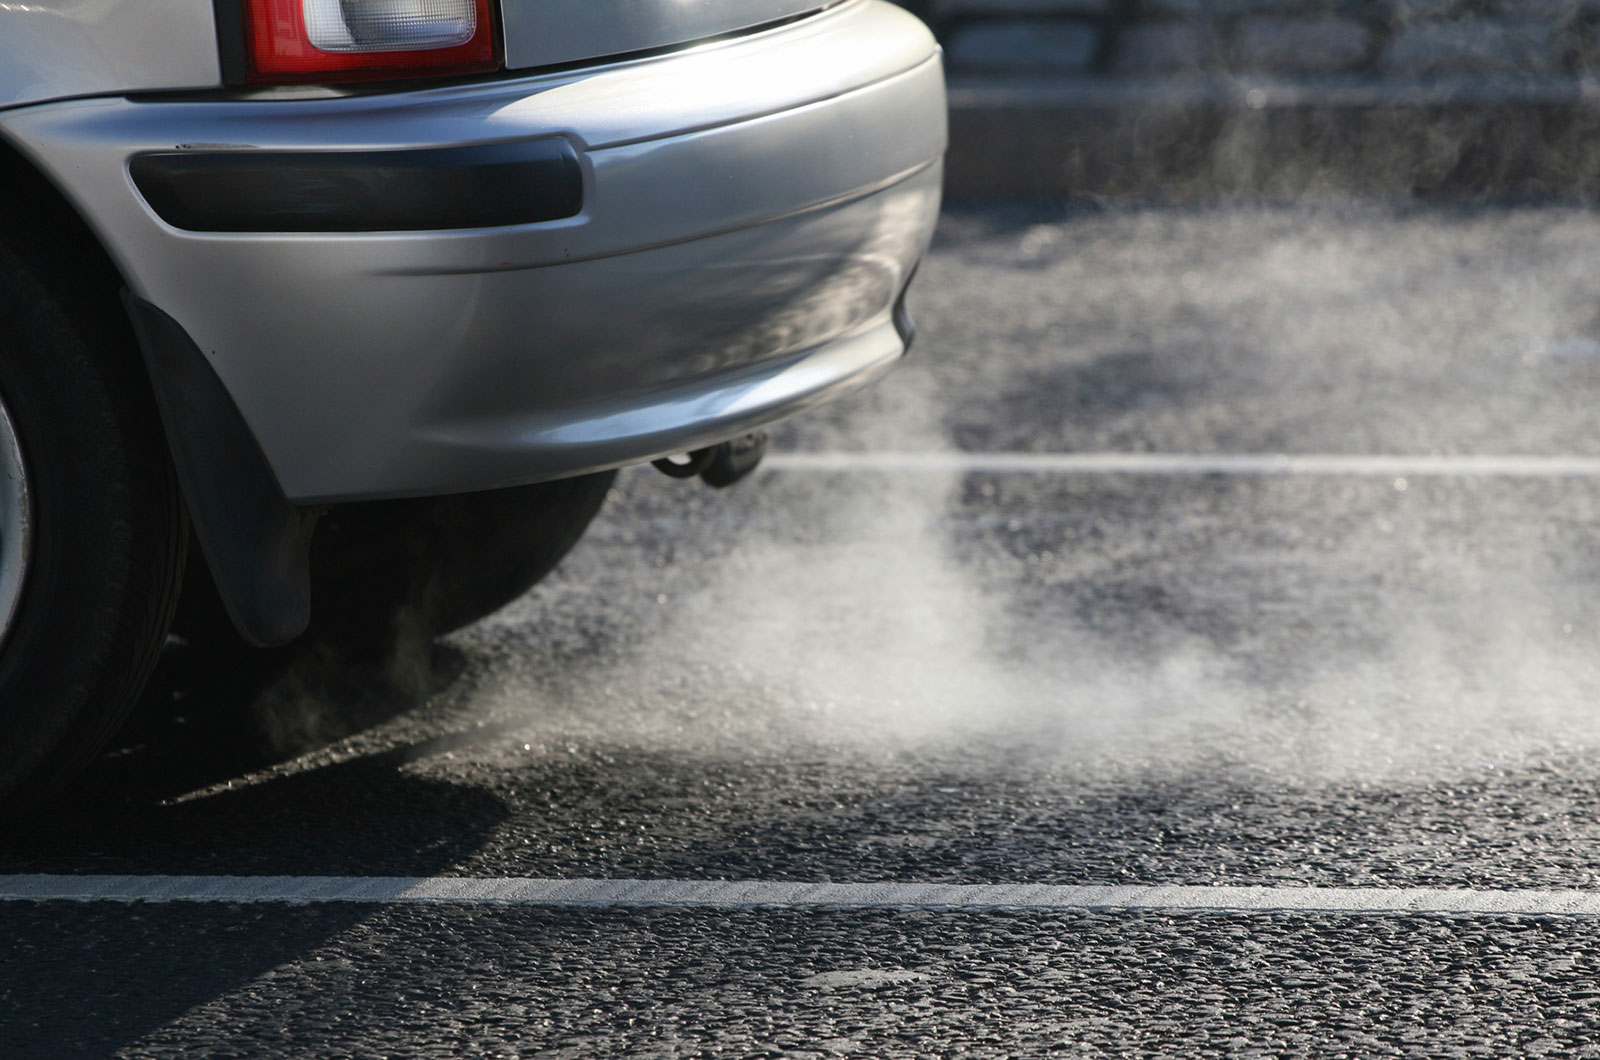
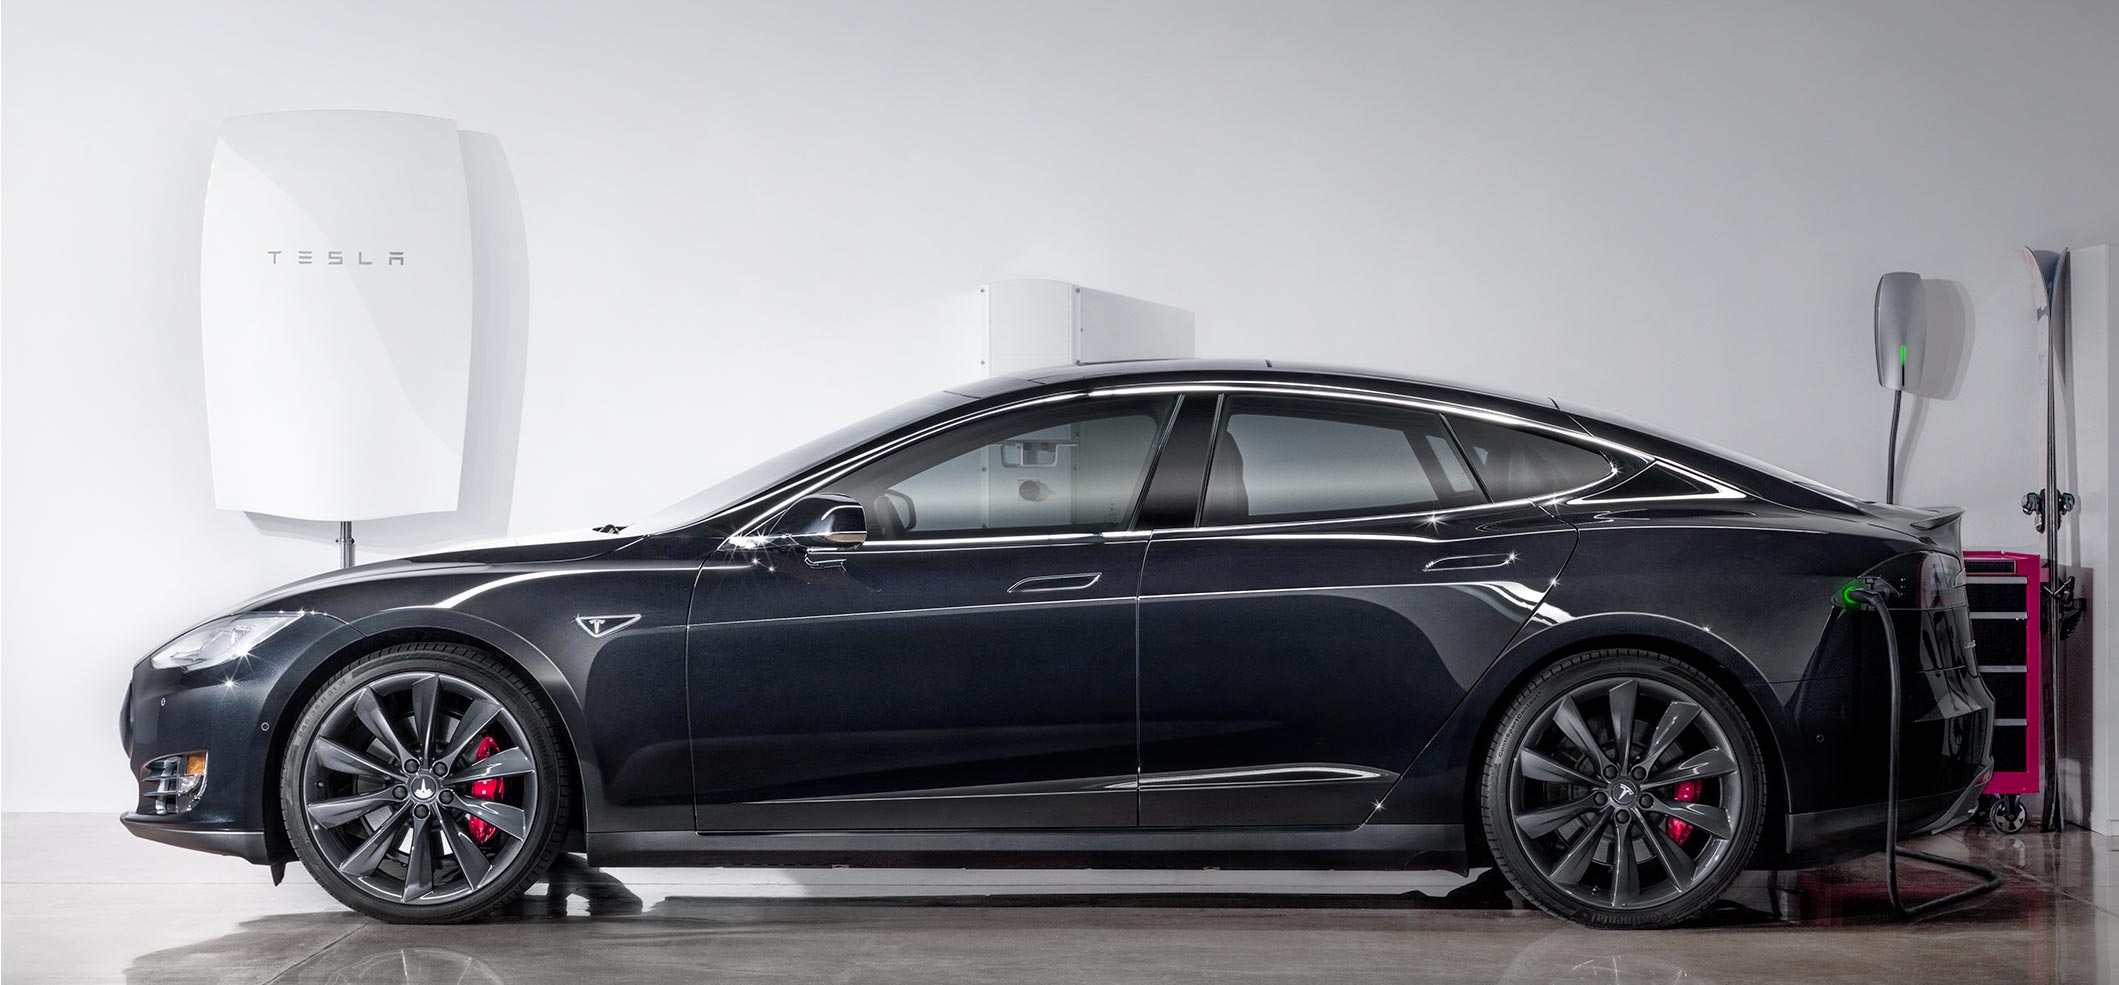
Cars emit a lot of NO2. Catalytic converters help, but they still produce NO2 in amounts that are harmful
VOCs are complicated. They are typically things you smell, like the new car smell, new elevators, paint, permanent markers, etc. Some people are highly sensitive or allergic to these. They can typically be filtered by most activated charcoal filters, because the carbon radicals in VOCs tend to adsorb well onto charcoal (ie they bond to it). We are going to ignore this, because we're assuming you don't like to leave your child in a freshly painted room, in new cars, or on new elevators.
Pollution Sources and Types
Hokay, so, now we need to discuss which pollution sources produce each. So I've made this helpful chart. These are relative amounts of pollution within their category, with no clear scaling criteria, but it gives you an idea of how different vehicles or power sources relate in terms of pollution. In other words, a two stroke engine clearly doesn't produce as much pollution as a coal fired power plant More important, these are rough relationships. You can have a wide range in each category, with a coal plant with no controls that burns high-quality coal producing significantly less pollution than the same design coal plant that burns low quality coal, for example.
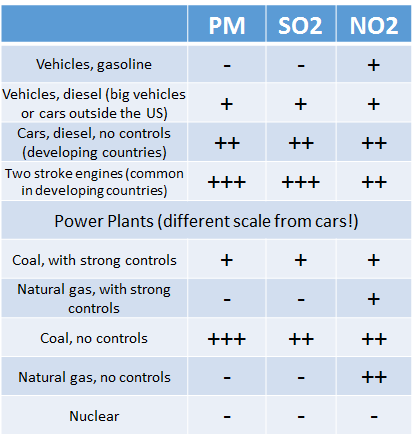
Chart with differing sources of pollution, and relative amounts of pollution produced by each.
Let's go through this one-by-one.
Vehicles burn gasoline or diesel. Gasoline vehicles pretty much just produce NO2 (and CO! But we are ignoring that for now), and our catalytic converters help reduce that. Smog is a byproduct of NO2 interacting with other pollutants that are already in the air. The part of smog that we see is actually PM pollution, rather than chemical pollution. Diesel vehicles produce a lot PM, and some SO2, and relatively more NO2. Catalytic converters can reduce NO2. Using low-sulfur diesel can reduce SO2. A lot of developing countries do not use low-sulfur diesel or catalytic converters, so they produce a ton more of every type of pollution. Two Stroke Engines are common in India (and other places, but not so much in China, and almost never in developed countries, unless you count lawnmowers). These things burn oil alongside gas. They produce nasty fumes, like your weedwacker or small lawnmowers. This is part of the reason that India has a particularly nasty type of air pollution. These are being phased out over time, with bans on new models of two-stroke engines in many cities.
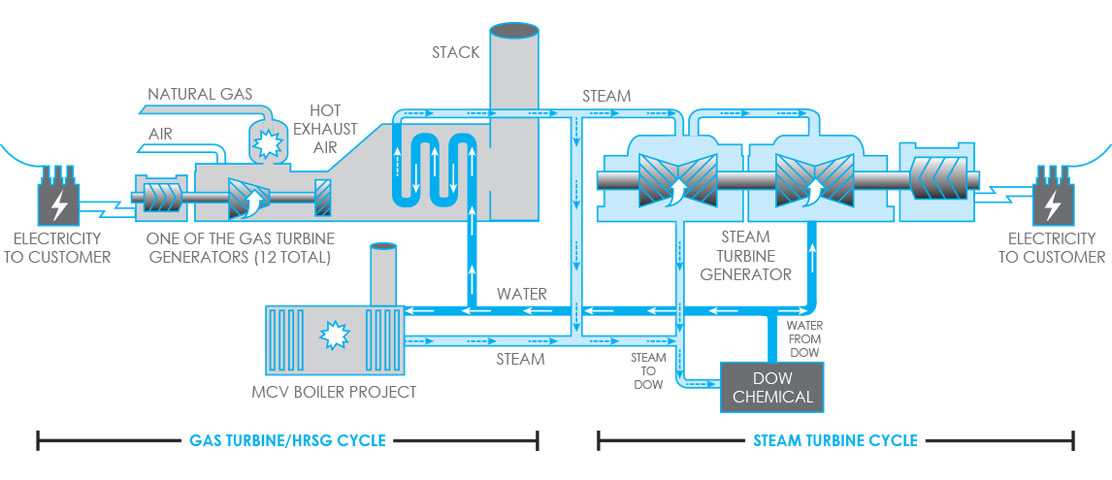
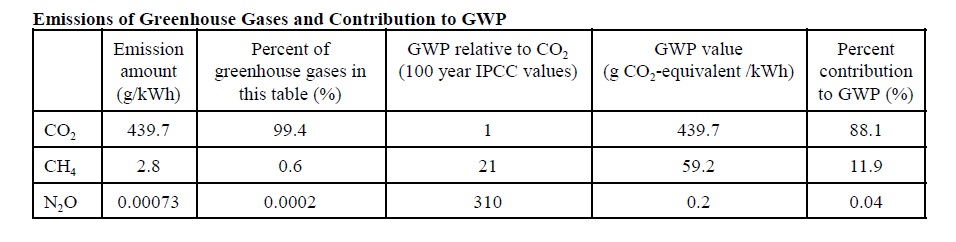
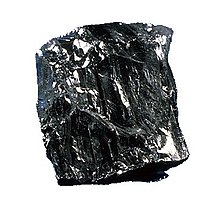
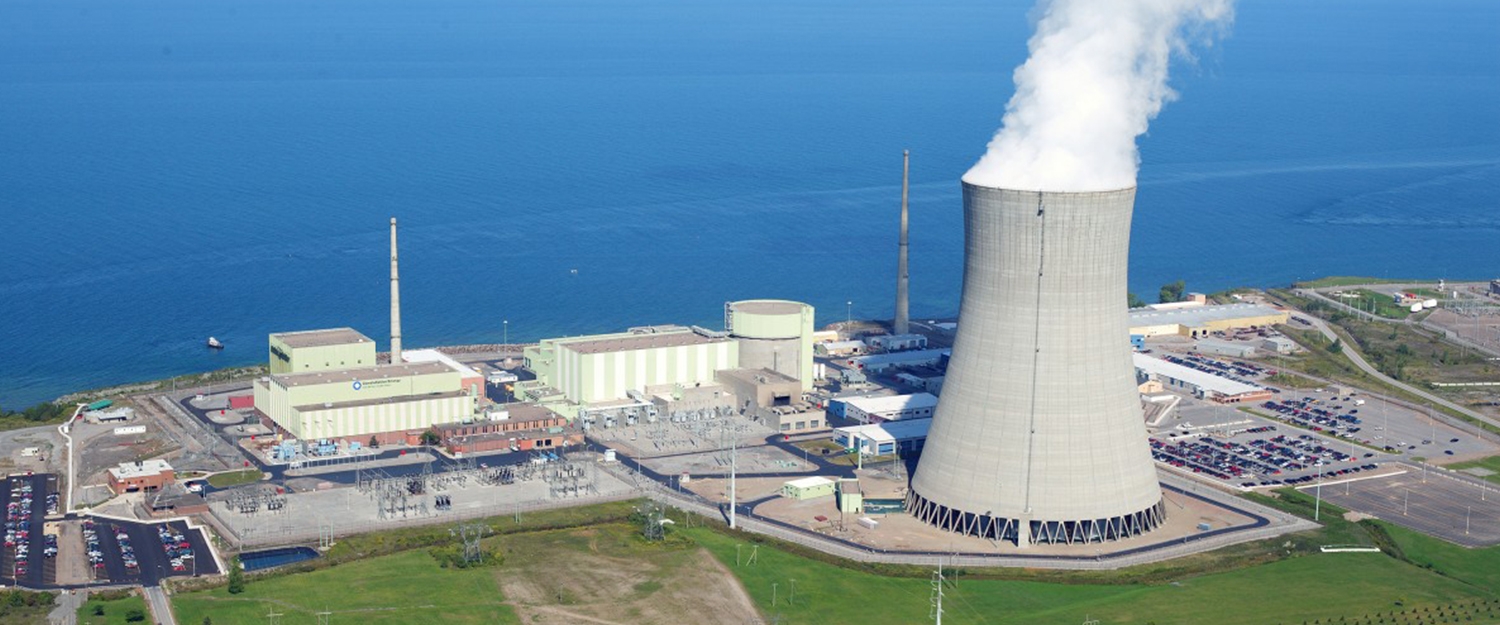
Power Plants are a lot more complicated. In the next post, I will be discussing pollution controls in power plants in more detail. Put simply, natural gas powerplants produce predominantly NO2. They burn CH4, and convert it to CO2 and H2O. NO2 emissions can easily be reduced by 90% with proper controls (discussed in the next post). Coal fired power plants can be nasty. With no controls and with using low-cost coal, they produce a lot of each type of pollution. PM is the result of impurities in the coal that can't be burnt, or unburnt specs of coal. Low-grade coal produces prodigious amounts of PM, and contains a lot of sulfur that burns to produce SO2. They produce a lot of NO2. All of this can be reduced greatly simply by building in controlling systems. These controlling systems are used in nearly every coal plant in developed countries and in many coal plants in advanced developing countries. They are completely ignored in nearly every coal plant in many developing countries.
Which should I be concerned by?
Traffic Pollution vs. Power Plant Pollution
Which of these should you care about? That depends on where you live. Most of the pollution in developing countries comes from power plants, but if you live next to a busy street or highway, traffic pollution could be the bigger concern. If you are in a developed country, particularly the US, traffic pollution is almost always the largest concern. Why? Because you are sitting directly next to the source. Whether you're biking or walking with your infant in a stroller, you are right next to the pollution. The problem exacerbates when you are nearby to a highway or major intersection, because there is a ton of traffic.
So, in short, if you are in the US and much of Europe, you should be worrying about the invisible (but smellable) traffic pollution that you are breathing in. If you are outside the US, it varies country by country. If you are in China or India, you need to be concerned about both traffic and powerplant pollution, and there is pretty much no escaping it.
Thanks for reading!
- Jason Munster


