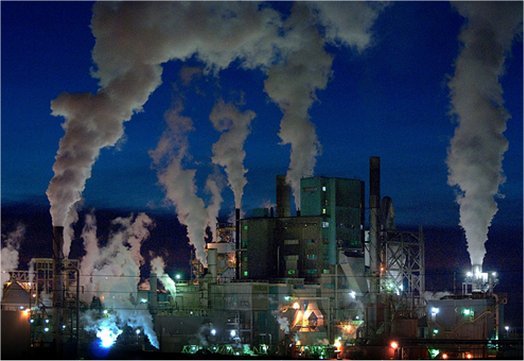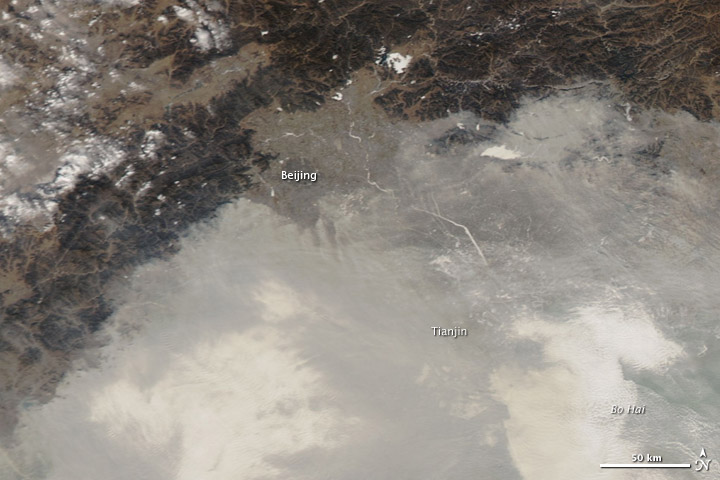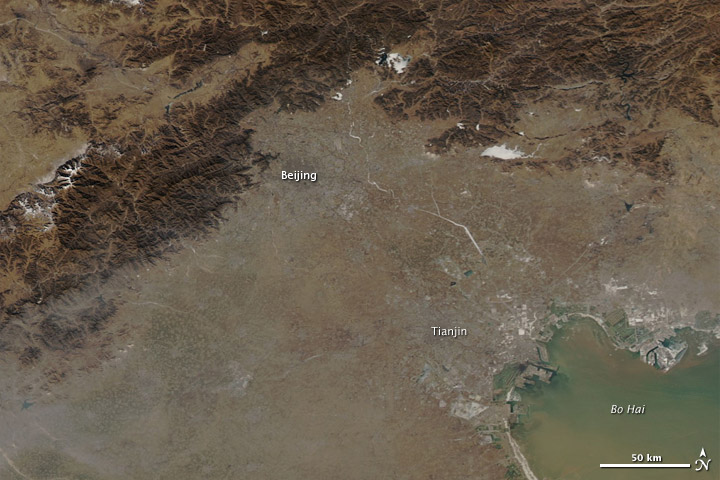
Today’s post is about the shift in US primary energy use from coal to natural gas (AKA methane). Hydrofracking, the hydraulic fracturing of rock to subsequently produce natural gas, is a new favorite pass-time in the US. Natural gas prices used to track oil prices per unit of heat. They now roughly track coal prices per unit heat. As a result, it is now economical to produce electricity from methane rather than coal. As we discussed before, coal produces a whole bunch of dirty pollution, and methane does not. All good, right?
This is very important for both CO2 emissions reduction and for reduction of other pollutants. The math section is chemistry heavy. If you are going to skip a math section, this is the one.
The highest grades of coal have composition  , and lower grade coal is
  All coal is tainted with mercury and other heavy metals. Lower quality coal has more pollutants per unit heat, and this produces more pollution for the same amount of electricity. From the last post, we learned burning coal has quite the array of negative health effects.
The chemical composition of natural gas is CH4. It contains almost no other pollutants. It doesn’t produce particulate matter. When it is burned to produce electricity, we do not have the direct adverse health effects associated with coal. What about the CO2 emissions? These are reduced. Cause of math.
The Math of Chemistry! This is bond enthalpy chemistry. (Feel free to skip ahead if you don’t like the math parts)
Let’s look more closely at the composition of these two things. When any substance burns, it produces heat by converting everything to H2O and CO2. The resulting H2O and CO2 have lower internal energy than the coal or methane that formed them. The difference in energy from the coal to the H2O and CO2 has to be given off as heat.
Before the math: First, what is a mol? It is short for mole. Pretty bad abbreviation, eh? A mol is the number of molecules it takes to make one g times the molecular weight of the molecule. It is  molecules. This is confusing. Lets use examples to make it less confusing. Hydrogen has a molecular weight of 1. A single mole of it weighs 1 gram. CH4 has a weight of 16 (12 for the carbon, 4 for each hydrogen). A mole of it weighs 16g. CO2 has a molecular weight of 44, and a mol of it is 44g. Done.
The amount of energy used to hold atoms together to make molecules is the bond energy. Chemical reactions happen, chemical compositions are changed. If the overall energy of bonds are lower after the change, heat has to be released. This creates fire.
Bond energies: C-C bonds (aromatic, the ring-type found in coal) have 519 KJ/mol. C-H is 410. H-O is 460. C=O (double bond) is 799. O=O are 494 KJ/mol.
We simplify coal as aromatic bond chains of 4(-CH-) (this is generous in terms of calculating CO2 produced per unit coal, as all my prior calculations have been) (I stole this clever approach from my advisor, Jim Anderson, to simplify things). CH4 is pretty easy as CH4.
We can write these as:


The molecular weight of our coal is 4*(12+1) or 52. Methane: 12*1+1*4 = 16
Coal: We break four C=C aromatic bonds (only four cause we would be double counting if we did each side of (-CH-), four C-H bonds, and 5 O=O bonds. We form 8 C=O and 4 H-O bonds.
Methane: 4 C-H bonds are broken, as well as 2 O=O bonds (the two O=O bonds are from converting the 4 H bonds into H2O). 2 C=O, and 4 H-O bonds are formed.
Coal: 
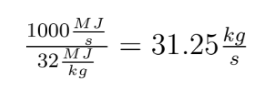
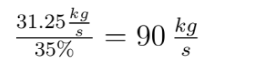
Methane: 
Math done!
The changing landscape of energy production based on cheap NG
Back in the day (pre-2010 or so) natural gas was much more expensive per unit heat than coal was. If you were going to burn something to produce electricity, coal was much cheaper and so produced cheaper electricity. The fact that it was pretty dirty didn’t matter as much. Then hydrofracking happened. Natural gas got cheap. Its price once roughly tracked with but below oil. Now it tracks with coal. This makes it a viable alternative to coal in power production. This fundamentally alters the primary energy landscape in the US. Once more data is available, we will revisit this.
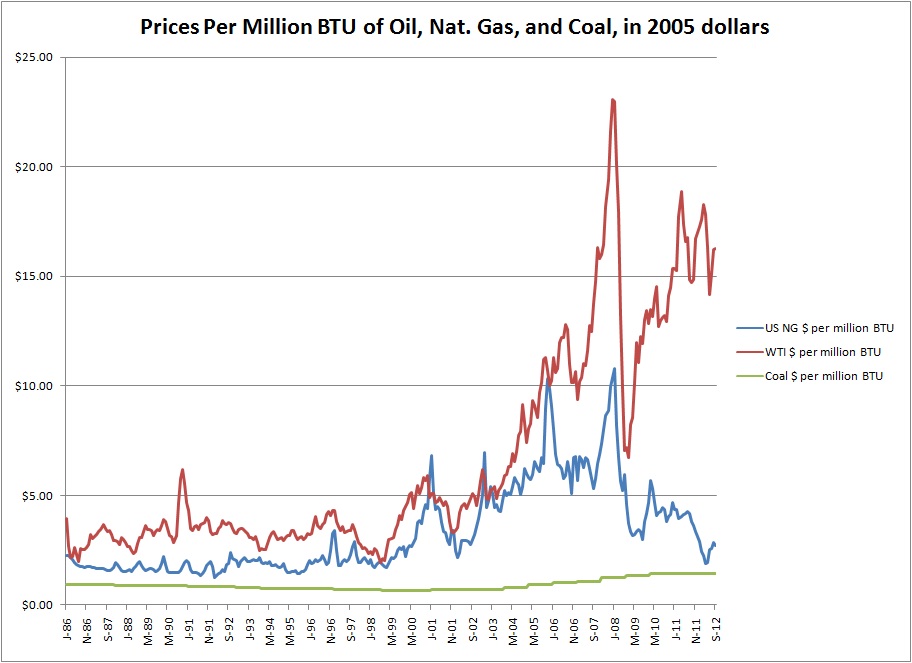
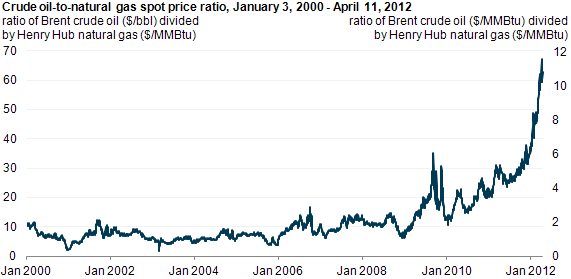
Historic hydrocarbon prices per million BTU. Natural gas roughly tracked with oil, until hydrofracking made a glut in the market
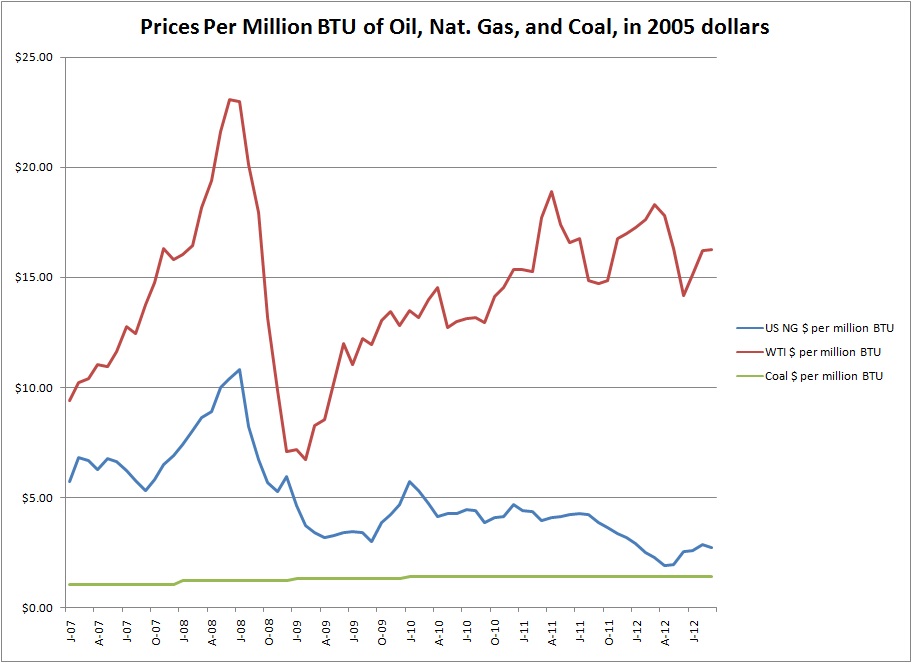
Zooming in on the recent few years, the divergence of oil and gas and convergence of coal and gas becomes evident
Let’s discuss policy and environmental implications. They are pretty huge.
The math shows that in energy per unit CO2 produced, methane is about 60% more efficient than coal. This means that if we have to burn either methane or coal, and we seek to limit CO2 production, methane is the natural choice. Historically pricing prevented this from happening.
Natural gas is now only slightly more expensive per unit heat than coal. It makes sense to make electricity from natural gas, cause it produces far less pollution per unit heat. Since 2008, the US has reduced the amount of CO2 is produces for the first time in a long time. The reduction of CO2 produced by the US is partially based on this change in natural gas price. We now produce more electricity from methane than we used to. Since methane is more efficient at producing energy per unit CO2 produced, we produce less CO2 as a country.
Many staunch environmentalists argue this is a bad thing. Natural gas is still a hydrocarbon and still produces greenhouse gases. It kills far fewer people directly than coal does. The deaths that came as a result of coal might have pushed us towards a much greener economy. Methane is the lesser of two evils. It produces energy like coal. It produces CO2. It is still a finite resource. It is much better than coal.
Coal: The great of two evils between coal and methane. A picture of anthracite coal to break up the monotony of a text well. From Wikipedia.
Barring legislation to prevent hydrofracking, this trend of cheap NG will continue for a long time in the US. We have massive reserves of natural gas in our shale, and hydrofracking can get it out. This is not limited to the US, but there are only a few countries in the world that will be able to do this.
Before closing, we have one last thing. Many of you looked at the graphs of natural gas prices, saw that they were historically not much higher than coal for many years, and wondered why we didn't have natural gas electricity plants then. There are two answers. The first is that we did. It is why we have so many right now that can instantly go online. The second answer is that the EPA really only started getting strict on coal plants in 2004. The emissions from coal plants add many costs that go beyond the price of coal. Natural gas is pretty clean, so it doesn't face these costs, making it more competitive with coal.
Summary: Hydrofracking in the US has changed the natural gas price to be much lower and has made it a basic energy feedstock rather than a premium one. The US has natural gas power plant capacity, and has started shifting to electricity from natural gas. These power plants produce less harmful emissions as a result. CO2 emissions are reduced for the same amount of electricity. Harmful pollutants that cause heart attacks, asthma, and early death are also reduced. This is pretty huge.
Thanks for reading again, and sorry for the huge length
Jason Munster
* Will pointed out that I had Avogadro's # off by a factor of 10. Fixed